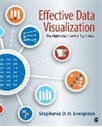
Effective data visualization: the right chart for the right data
"Written by sought-after speaker, designer, and researcher Stephanie D. H. Evergreen, Effective Data Visualization shows readers how to create Excel charts and graphs that best communicate data findings. This comprehensive how-to guide functions as a set of blueprints-supported by research and...
| Main Author: | Evergreen, Stephanie D.H. |
|---|---|
| Institution: | ETUI-European Trade Union Institute |
| Format: | TEXT |
| Language: | English |
| Published: |
Beverly Hills
2016
Sage Publications |
| Subjects: | |
| Online Access: | https://www.labourline.org/KENTIKA-999812471709-effective-data-visualization-t.htm |
Similar Items
-
Data visualization: a practical introduction
by: Healy, Kieran
Published: (2018) -
European statistics on accidents at work (ESAW). Specifications for phase 1 data on work accidents in Europe - reference year 1994
Published: (1996) -
European statistics on accidents at work: methodology
Published: (1998) -
European statistics on accidents at work (ESAW): methodology
Published: (2001) -
Statistiques européennes sur les accidents de travail : méthodologie
Published: (1999)


